Project overview
The Project overview page displays a summary of your bot performance.
You can analyze how successfully your bot achieves its business goals. For example, after sending a text campaign, you can analyze:
- How fast the number of bot users is growing.
- How much the number of requests for specific topics has increased.
- How many target actions your users perform.
For this purpose, you have access to:
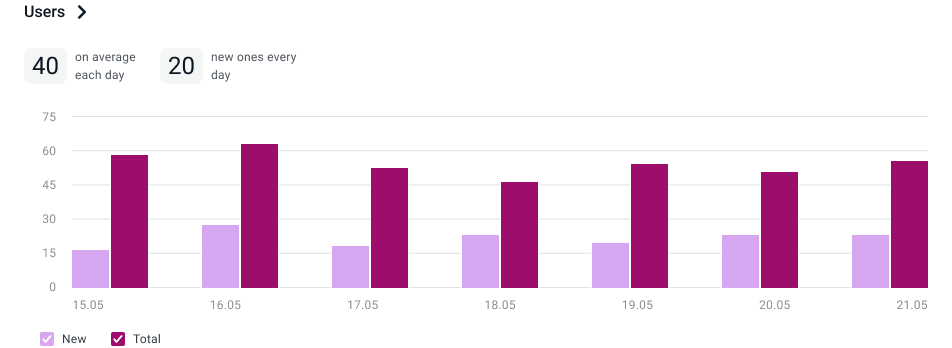
- Key metrics: the average number of users who communicate with the bot daily, the number of new users, and changes in these values within a period.
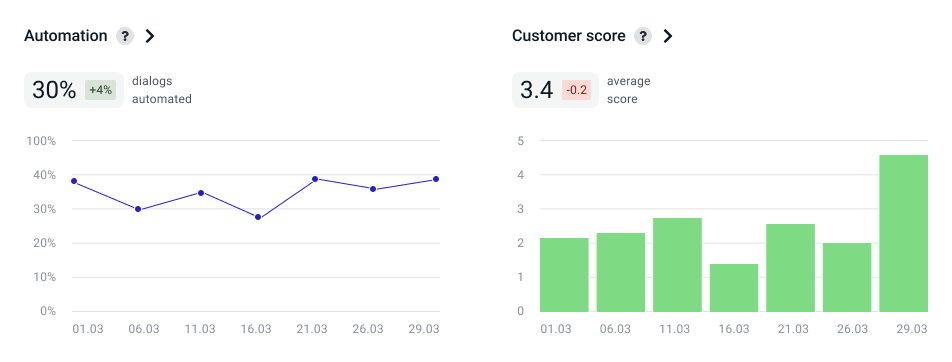
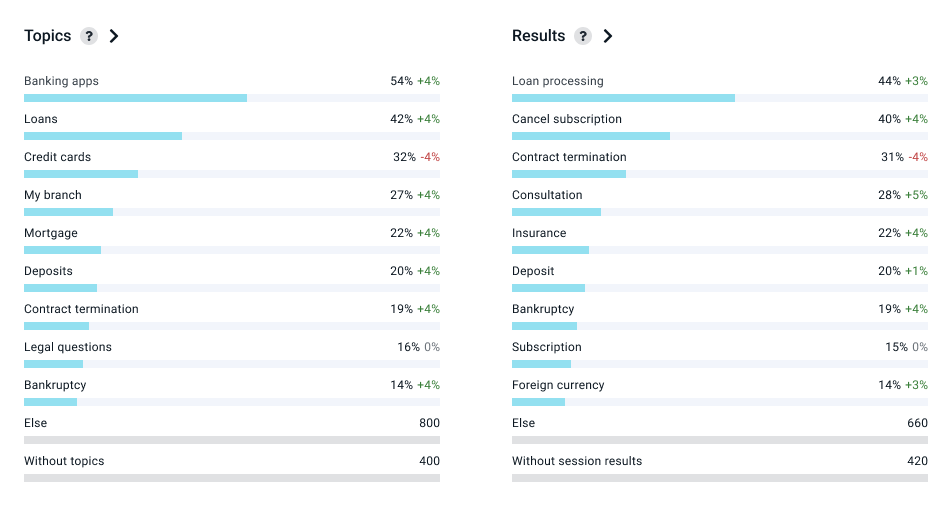
- Additional metrics: the number of automated dialogs, evaluations from users, statistics of requests by the topic, and session results.
This data will be useful to evaluate the overall bot performance and refine the script logic.
Filters
Use the filters at the top of the screen to select:
- The period for which you want to display statistics. You can select a specific date or time period. Filtering by day, week, and month is available.
- Channels on which you want to receive the data. You can display data for all channels or just one channel. You can also view statistics for deleted channels.
Key metrics
The Metrics section shows the total number of users, the number of new users, sessions and incoming messages for the selected period. Next to the total value, you will see percentage change in these metrics compared to the previous period, for example, +4%.

In the Users section, there is a chart with the number of users for the selected period:

Additional metrics
The charts below show statistics for the following metrics:
- Automation — percentage of dialogs that the bot processes without the help of an agent.
- Customer score. The display of the chart depends on how you measure the metric in the script. For example, it may be CSAT, NPS, or CSI.
- Topics — analytics on the specified topics of user requests.
- Results — analytics on the specified session results.

